Client: Cardinal Senior Benefits (CSB)
Industry: Insurance & Financial Services
Objective:
CSB needed a robust, real-time dashboard to monitor their financial operations, track agent performance, and ensure data integrity. Their GoHighLevel ledger contained crucial business data, but inconsistencies, duplicate records, and missing entries hindered their ability to make data-driven decisions efficiently. They required a fully automated, user-friendly, and dynamic reporting system to streamline operations.
Challenges:
- Data Discrepancies: The ledger had duplicate entries, incorrect mappings, and missing data points, making financial tracking unreliable.
- Fragmented Data Sources: Multiple tables needed to be merged and mapped accurately for a unified reporting structure.
- Manual Reporting Bottlenecks: The previous reporting process was slow and prone to errors, often requiring manual intervention.
- Lack of Real-Time Insights: Decision-makers lacked instant access to KPIs, leading to delays in business strategies.
Solution:
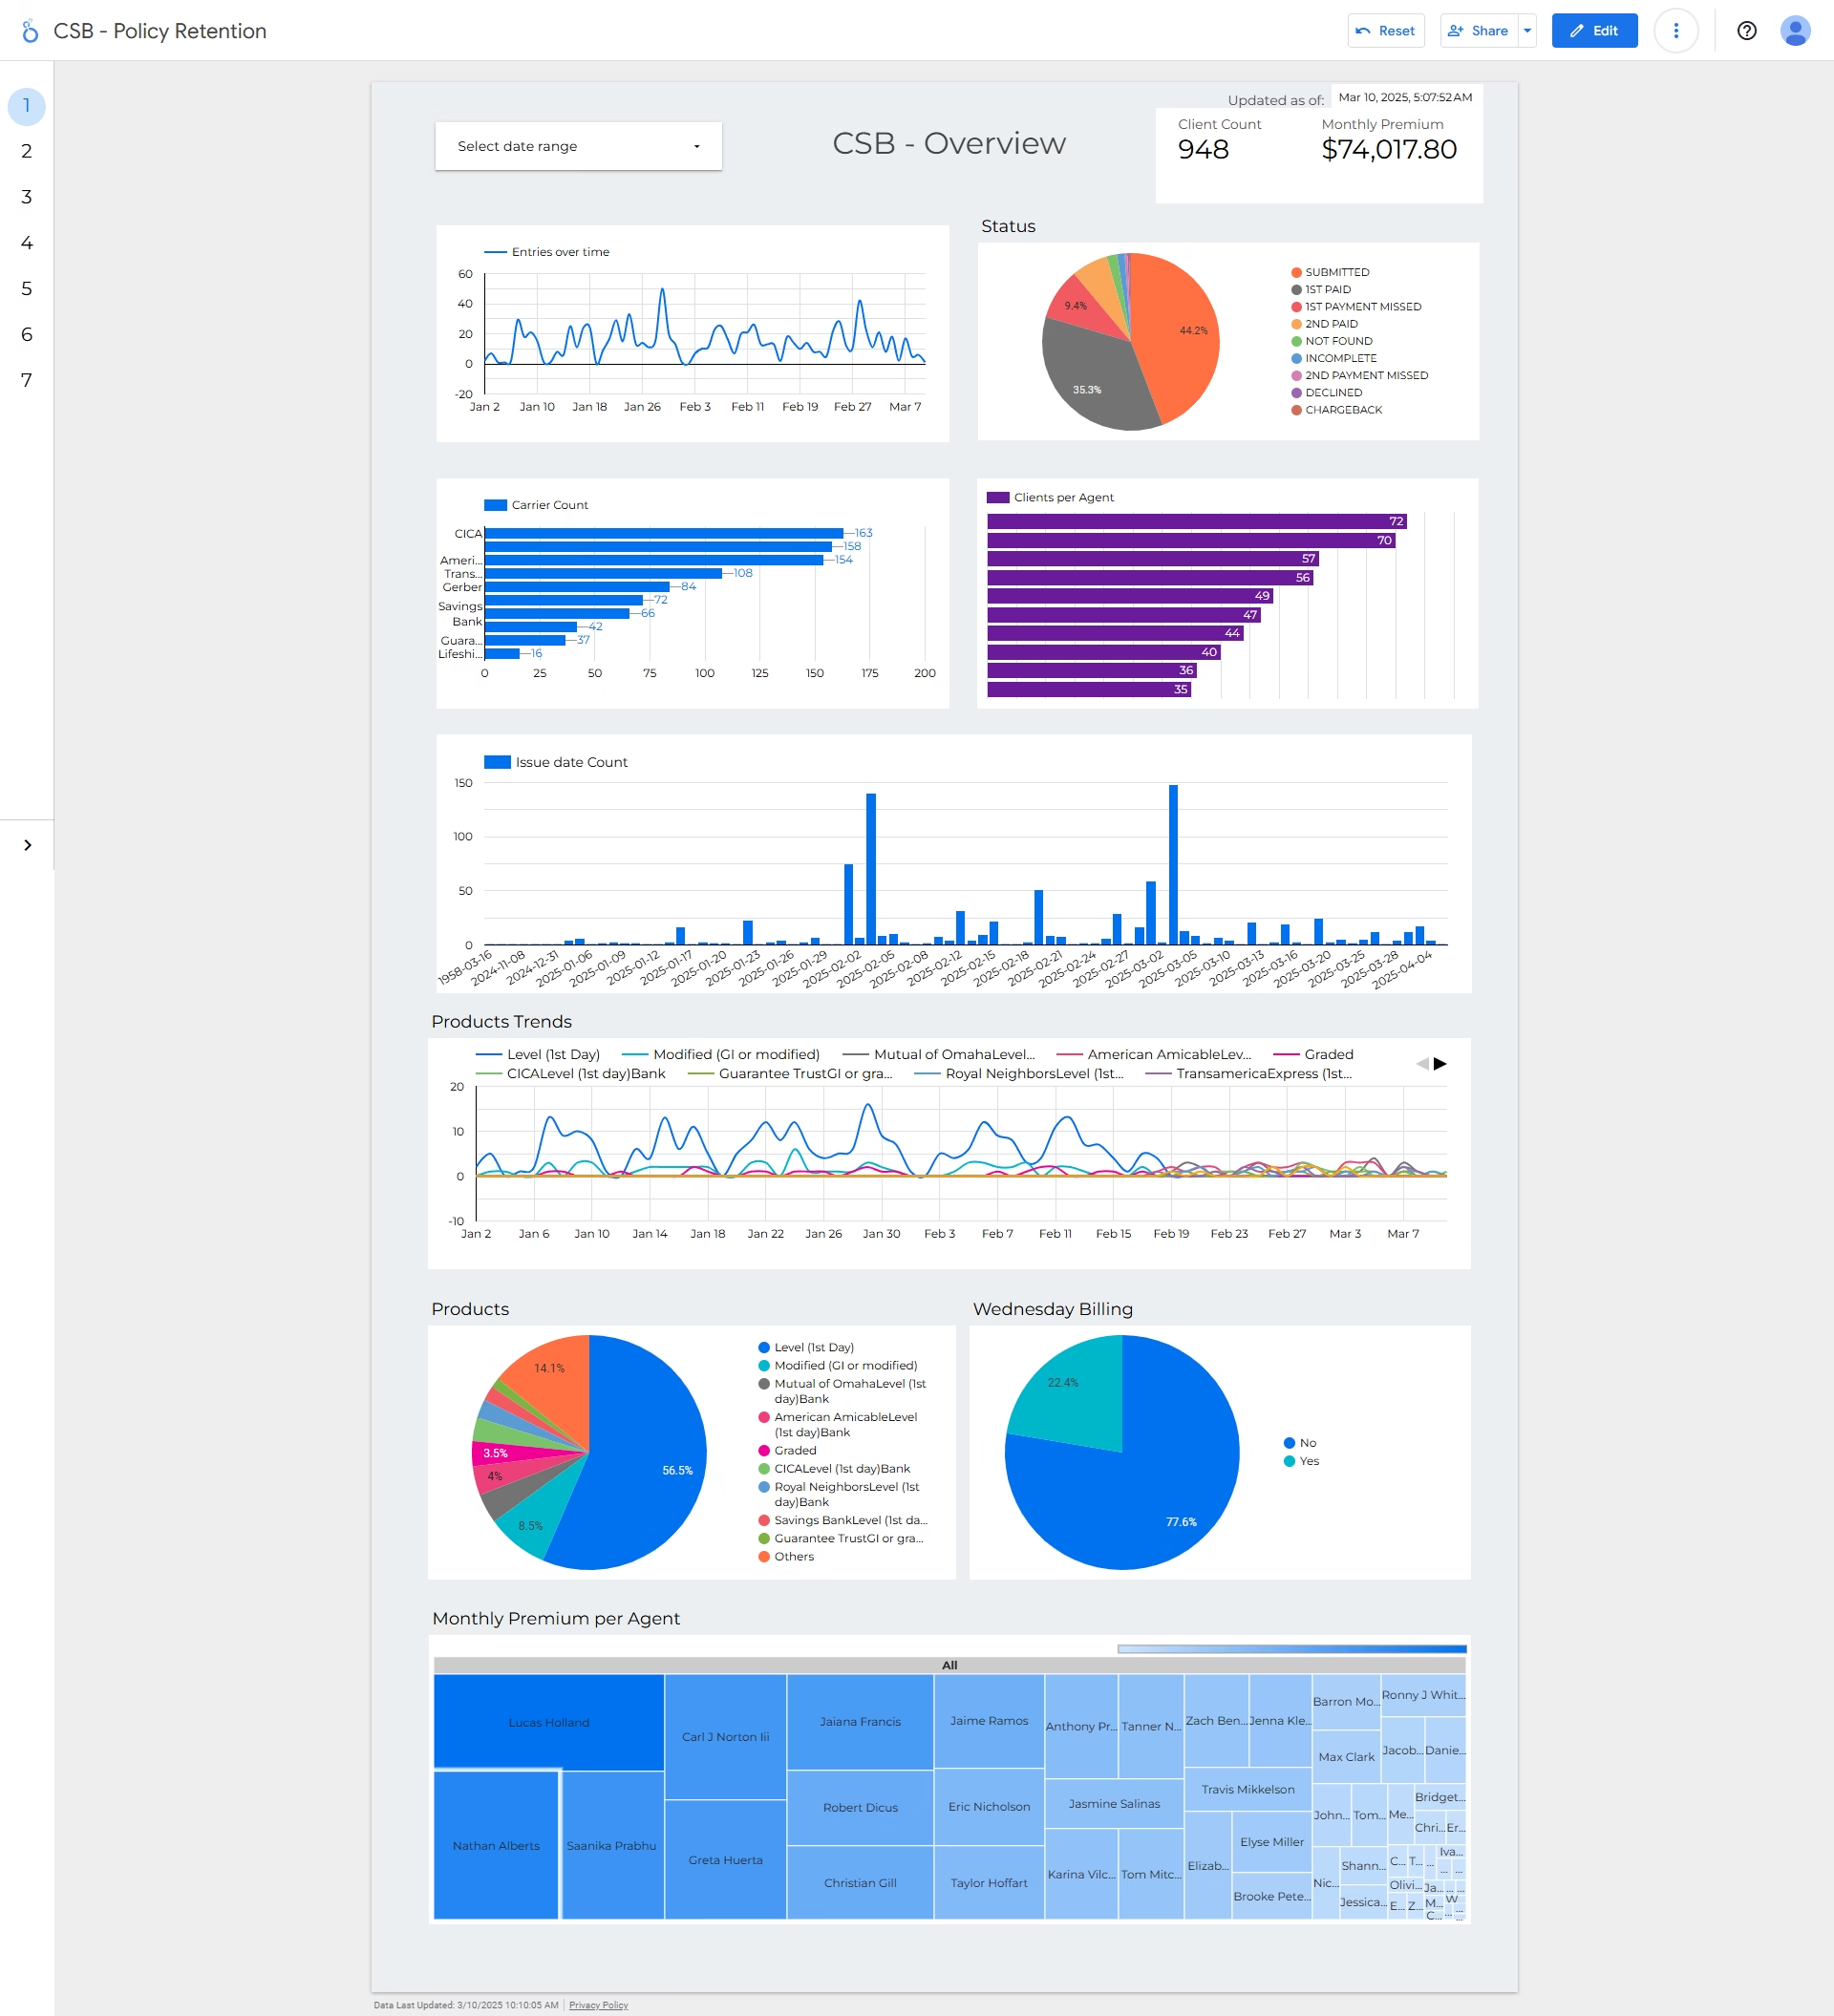
We designed a custom Looker dashboard that seamlessly integrates with CSB’s GoHighLevel ledger, ensuring accurate, real-time financial and operational insights.
Key Features:
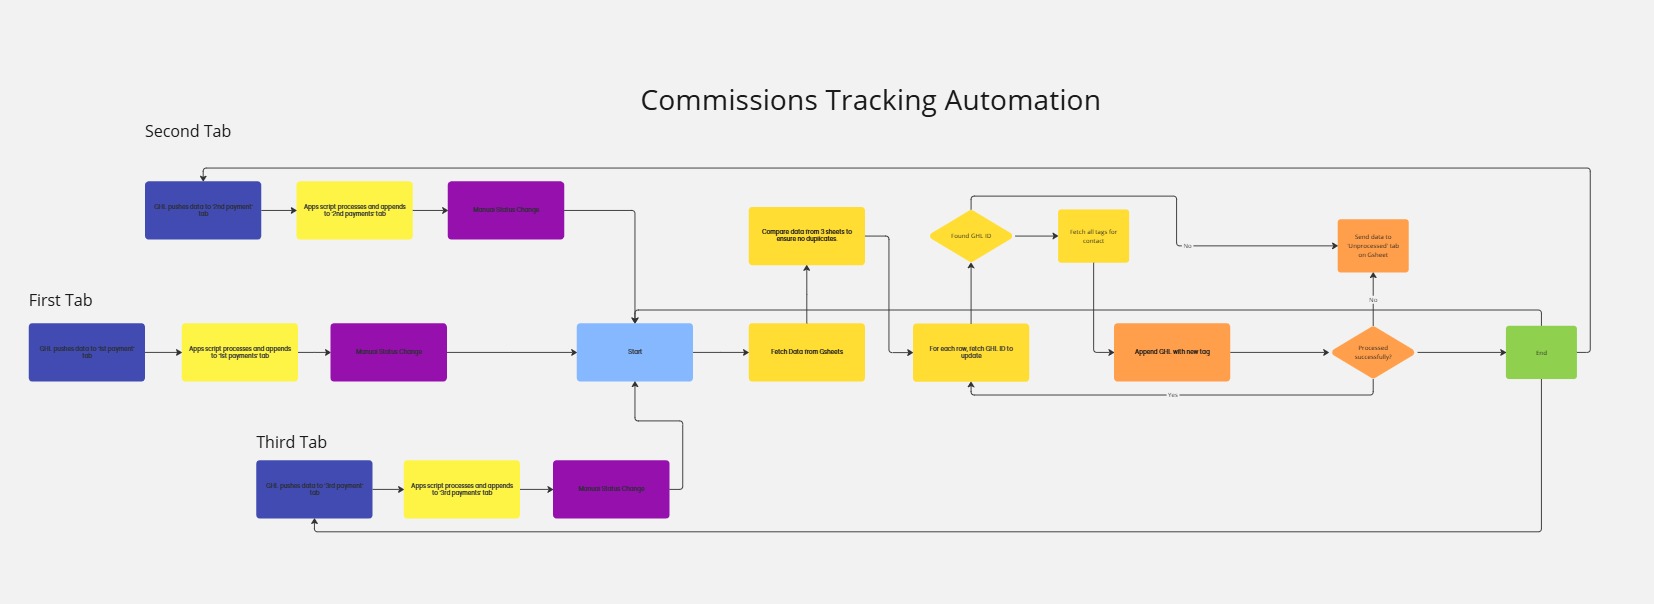
✅ Automated Data Processing: The system cleans, deduplicates, and corrects missing data before displaying insights. ✅ 5-Page Interactive Dashboard:
- Overview Page: High-level KPIs for at-a-glance business monitoring.
- Carrier Overview: Tracks transactions and trends by insurance carrier.
- Agent Overview: Monitors individual agent performance, productivity, and sales metrics.
- Client Overview: Provides insights into client retention, policy renewals, and claims.
- Agent Bonuses: Displays real-time commission calculations and incentive structures. ✅ Real-Time Updates: The dashboard refreshes every 5 minutes, ensuring the latest financial data is always available. ✅ Advanced Filters & Cross-Filters: Users can drill down into specific metrics, compare performance across dimensions, and segment data easily. ✅ User-Friendly Interface: Designed for non-technical users with intuitive navigation and clear visual representations.
Results:
📈 99% Reduction in Manual Data Processing Time: Automation eliminated the need for manual corrections and reporting. 📊 100% Real-Time Accuracy: Ensured decision-makers always have the latest insights. 🚀 Increased Operational Efficiency: Faster access to financial metrics allowed CSB to optimize agent performance and carrier relations. 📢 Enhanced Decision-Making: Cross-filtering and segmentation capabilities provided deeper analytical insights, leading to more informed business strategies.
Client Testimonial:
“This dashboard completely transformed our financial tracking. We no longer spend hours fixing errors or compiling reports—everything updates in real-time. It’s an absolute game-changer for our brokerage.”
Conclusion:
With a custom Looker dashboard powered by automated data processing and real-time analytics, CSB can now efficiently track financial operations, monitor agent performance, and make data-driven decisions instantly. This project showcases how advanced data integration and visualization can revolutionize insurance operations.
Looking for a similar solution? Contact Us today to optimize your data workflows and boost operational efficiency!


