Looker Dashboard Integration with GoHighLevel Ledger
A custom Looker Studio dashboard on GoHighLevel ledger data gives an insurance brokerage real-time financial reporting and cuts manual processing 99%.
- 99%
- less manual processing
- 5 min
- refresh interval
- 100%
- real-time accuracy
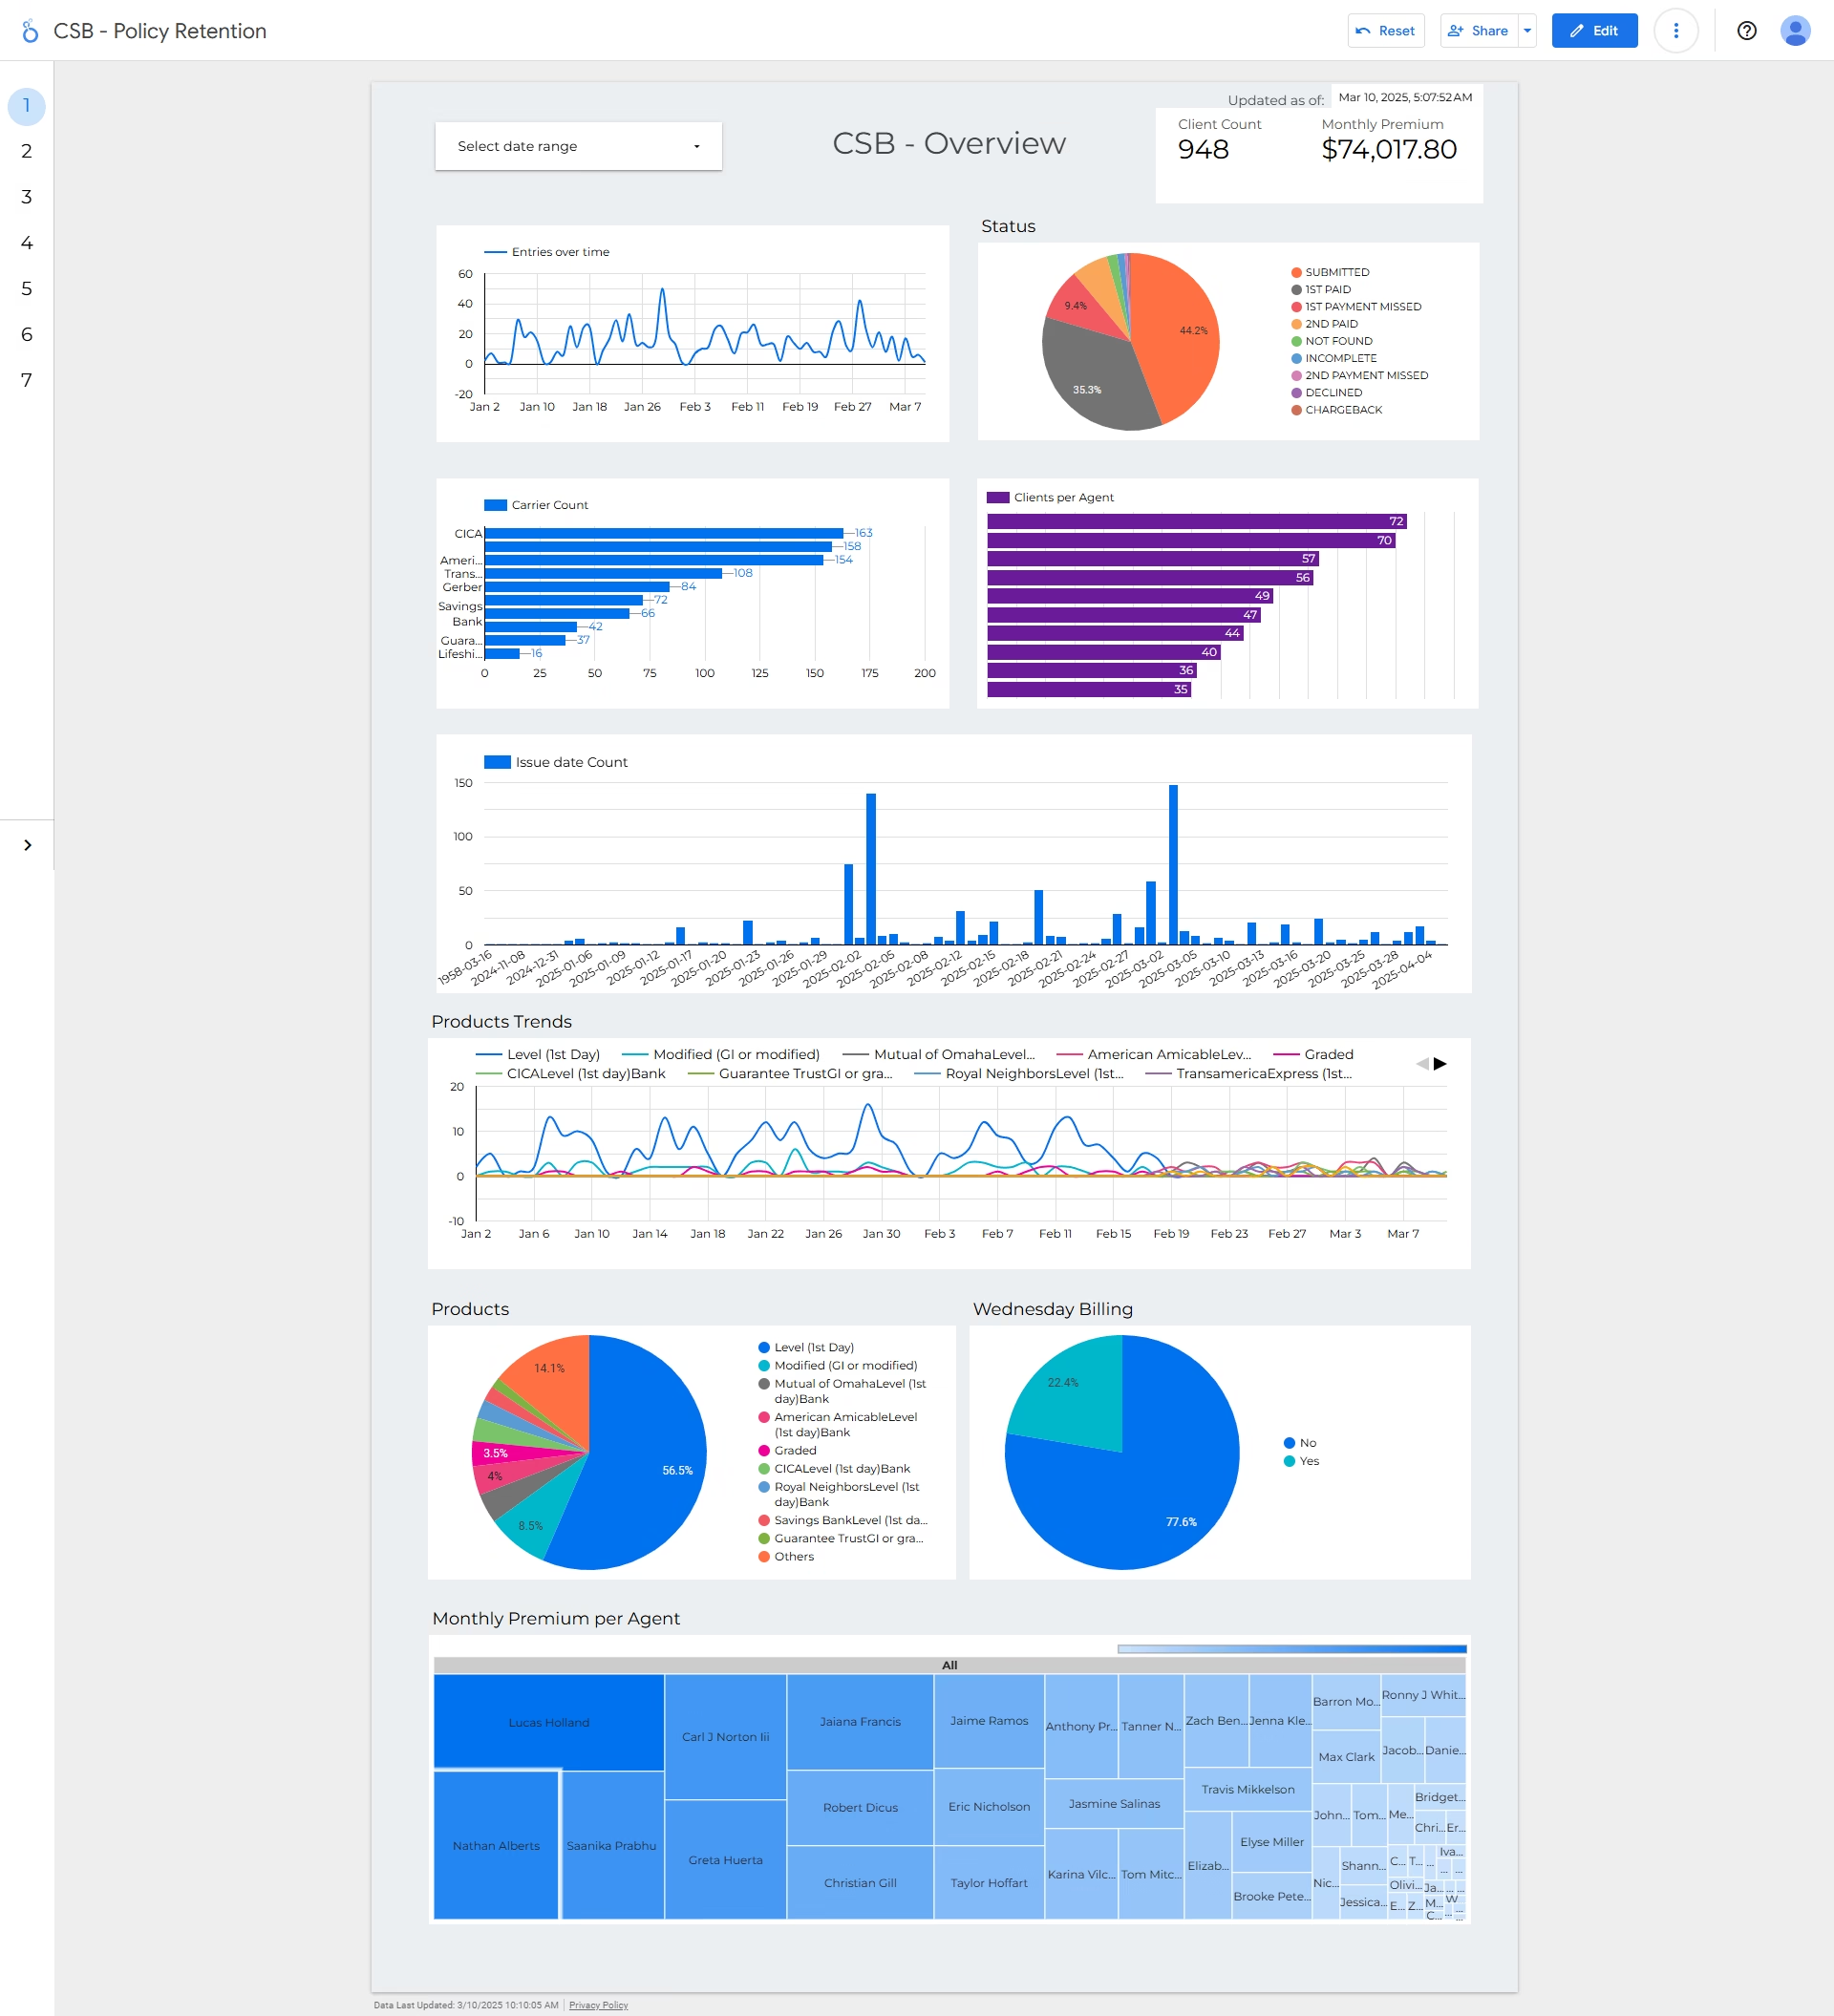
Cardinal Senior Benefits (CSB), an insurance and financial services brokerage, runs its business on a GoHighLevel ledger. The ledger held the data CSB needed to track financial operations and agent performance, but not in a form anyone could trust. We built a custom Looker Studio dashboard that cleans the ledger automatically and turns it into real-time financial and operational reporting.
The problem
CSB's reporting was blocked by four issues:
- Data discrepancies. The ledger contained duplicate entries, incorrect mappings, and missing data points, so financial tracking was unreliable.
- Fragmented sources. Multiple tables had to be merged and mapped accurately before any unified reporting was possible.
- Manual bottlenecks. Reports were compiled by hand, slowly, and errors crept in along the way.
- No real-time view. Decision-makers had no instant access to KPIs, which delayed business decisions.
What we built
A five-page interactive Looker Studio dashboard, fed by an automated processing layer that cleans, deduplicates, and corrects the GoHighLevel data before it reaches a chart:
- Overview — high-level KPIs for at-a-glance monitoring.
- Carrier overview — transactions and trends by insurance carrier.
- Agent overview — individual agent performance, productivity, and sales metrics.
- Client overview — client retention, policy renewals, and claims.
- Agent bonuses — real-time commission calculations and incentive structures.
How it works
The pipeline validates the ledger continuously, so corrections that used to be manual happen upstream and invisibly. The dashboard refreshes every 5 minutes, keeping the latest financial data on screen at all times.
Filters and cross-filters let users drill into specific metrics, compare performance across dimensions, and segment data without writing a query. The interface was designed for non-technical users: clear navigation, clear visuals, no training required.
Results
- 99% reduction in manual data processing time. Automation removed the need for hand corrections and report compilation.
- 100% real-time accuracy. Decision-makers always work from the latest figures.
- Faster operations. Quick access to financial metrics lets CSB optimize agent performance and carrier relationships.
- Better decisions. Cross-filtering and segmentation surface the detail behind every headline number.
The team no longer spends hours fixing errors or compiling reports — everything updates on its own, every 5 minutes.