Interactive Role-Based Dashboard for a Financial Institution
Role-based analytics dashboard gives a financial institution with 1M+ clients real-time visibility of loan portfolios, risk, and operations.
- 1M+
- active clients
- 3.5M
- historical clients
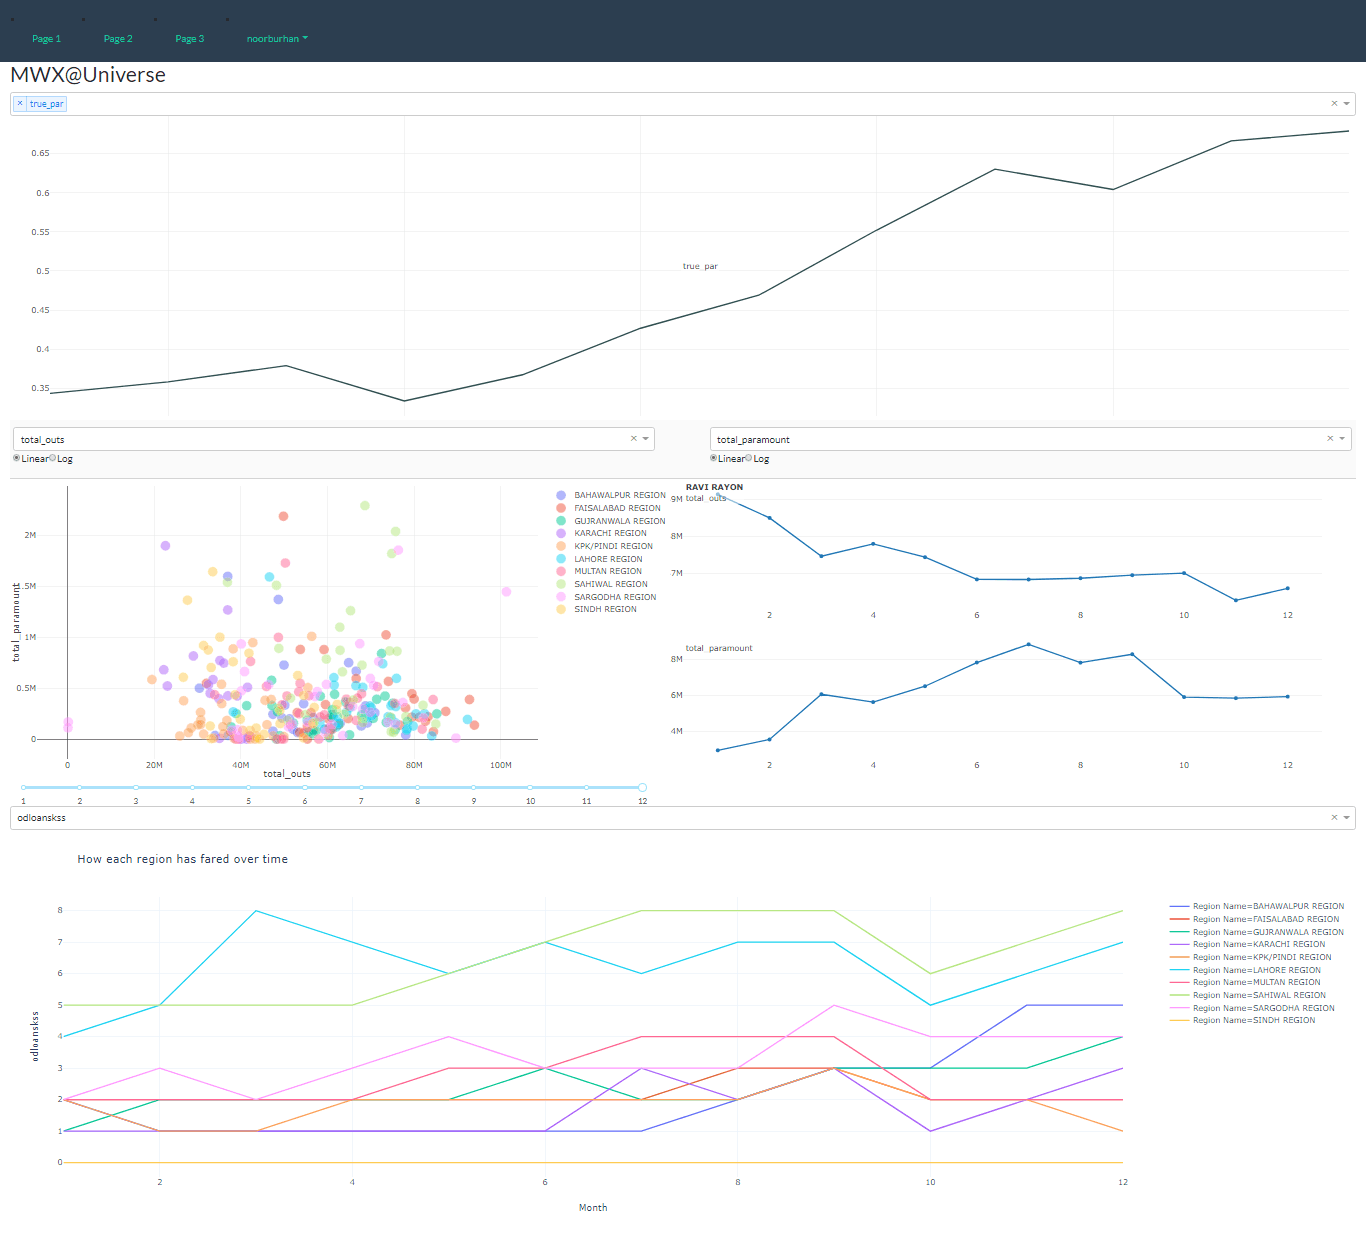
A financial institution serving more than a million active clients — with records for 3.5 million historical clients — wanted deeper insight into its loan portfolios, risk exposure, and operational performance. Standard reports and spreadsheets were no longer enough. We built a fully interactive, role-based dashboard that gives leadership real-time, drill-down analytics across the whole business.
The problem
Data streamed in from multiple departments — finance, HR, and operations — and managing it was becoming increasingly complex. The institution needed a secure, at-a-glance platform to track critical metrics such as Portfolio at Risk (PAR), Gross Loan Portfolio, and product usage trends across its large client base. At the same time, executive stakeholders wanted the flexibility to explore additional data points — financial ratios, operational sustainability metrics — on the same interface, without exposing sensitive data to the wrong teams.
What we built
We engineered a fully customizable dashboard on Dash (Plotly). Before writing any interface code, we mapped out user roles and permissions. Role-based access control (RBAC) gives senior management direct visibility into high-level KPIs while keeping confidential data appropriately segmented for other teams. The design is modular: each department gets a tailored dashboard, all connected in one cohesive ecosystem.
How it works
Data integration and cleansing
We gathered live data from the client's internal systems, third-party APIs, and historical databases, then cleaned and merged it into a unified data model. Every visualization and metric on the dashboard draws from this single source.
Interactive visualizations
Dash powers drill-down charts for PAR, Gross Loan Portfolio, and real-time product usage statistics. Senior management can pivot views instantly — zeroing in on specific client segments or time frames.
Financial ratios and metrics
Dedicated modules cover financial management KPIs such as liquidity and profitability ratios, plus the Operational Sustainability Score (OSS). Each renders as a high-level overview with the option to dive into a granular breakdown.
Expansion to HR and beyond
The modular design allowed swift expansion to HR data — employee productivity and retention — and other operational analytics, without reworking the core platform.
Impact
Leadership now understands the company holistically and bases decisions on real-time insight rather than stale reports. The dashboard cuts the time spent on manual reporting by streamlining the monitoring of financial ratios, operational indicators, and HR measurements. The institution controls risk more tightly and responds faster to changes in the market — and the platform's modular architecture leaves room to grow as its needs evolve.