Real-Time Intelligence Mapping for Defense: A GIS Dashboard Case Study
A secure real-time GIS dashboard on BigQuery and Dash Plotly gives a European intelligence agency live visibility of military activity in Ukraine.
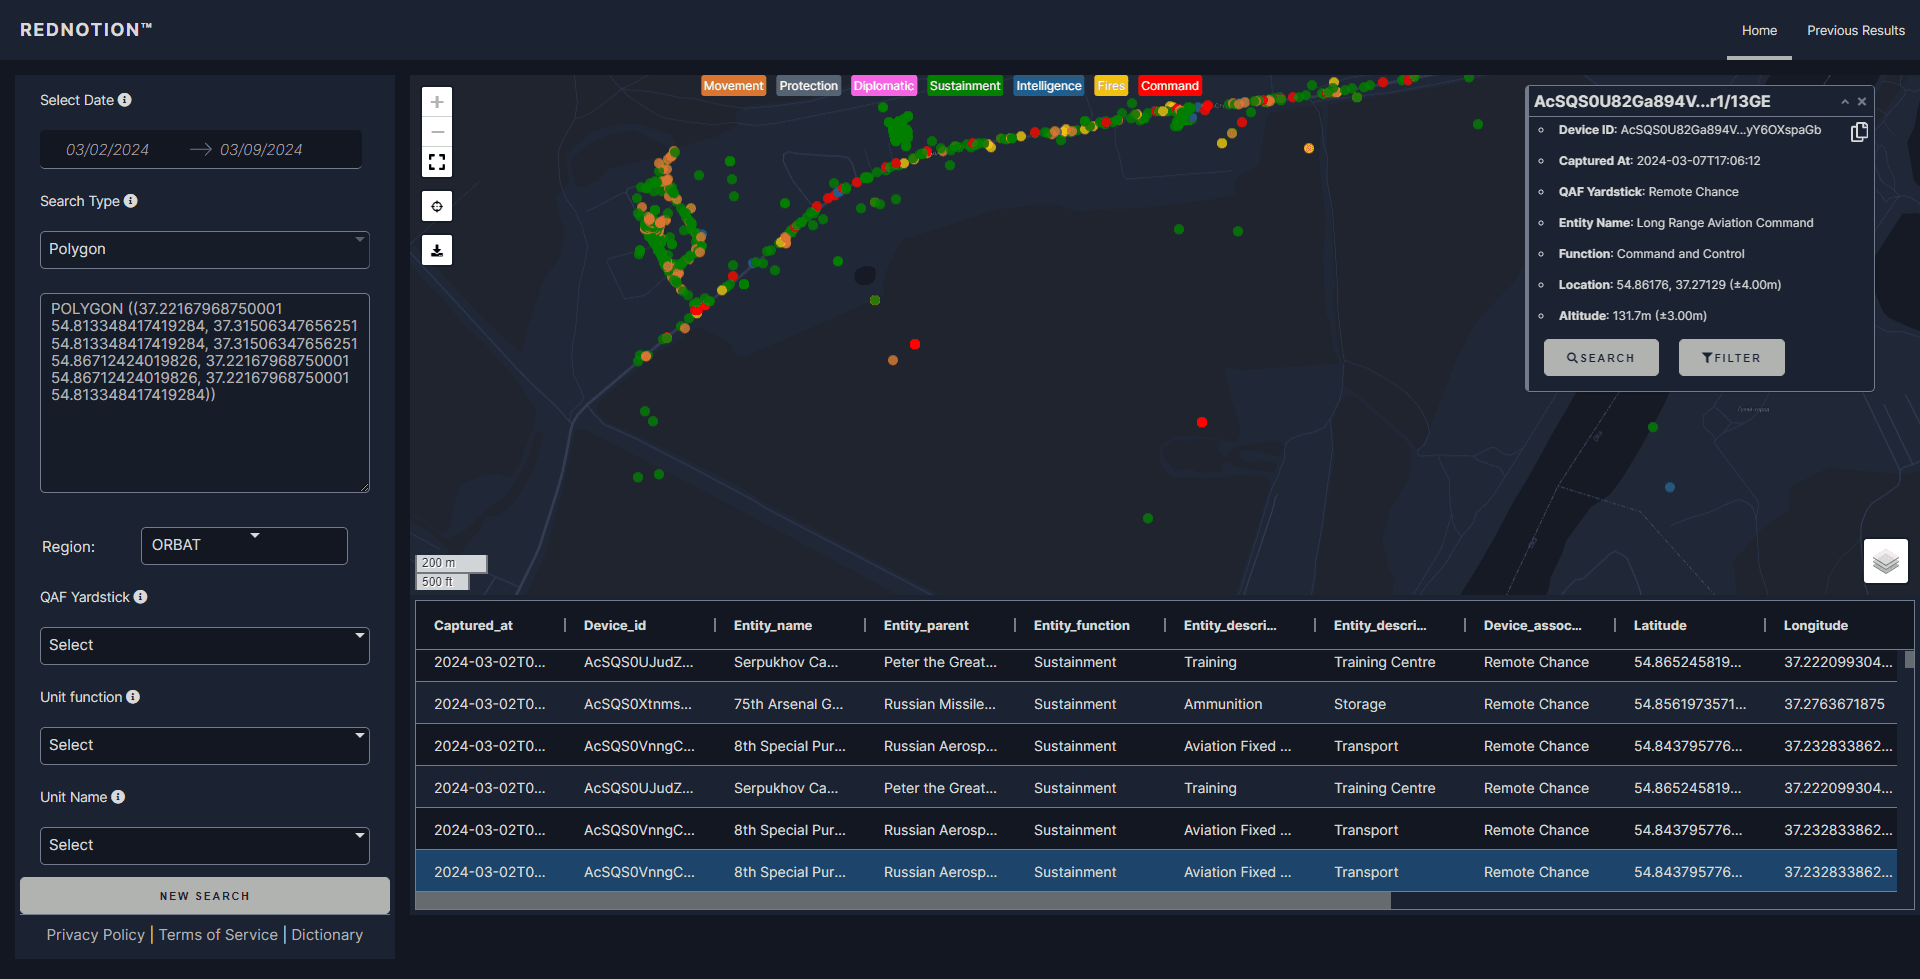
A strategic intelligence organization in the European Union needed a detailed, current picture of the evolving conflict in Ukraine. We built a secure, real-time GIS dashboard that fuses satellite imagery, mobile phone data, and open-source intelligence (OSINT) into a single view of military activity — unit locations, supply lines, and defensive positions. The system runs on Google BigQuery, is visualized in Dash Plotly, and informs decisions for defense stakeholders including the U.S. Army.
The problem
Tracking an active conflict means reconciling large, fast-moving geospatial datasets from very different sources — satellite feeds, communications metadata, OSINT reporting — and putting the result in front of analysts quickly enough to matter. The client needed end-to-end delivery: data acquisition, pipeline setup, visualization, secure access management, and real-time analytics.
What we built
Secure ingestion and storage
- Google BigQuery centralizes large volumes of satellite and cell phone data in a single, scalable warehouse, with near-instant retrieval of geospatial insights regardless of dataset size.
- APIs and custom connectors pull real-time intelligence from multiple sources automatically, cutting manual overhead and improving data accuracy.
GIS-driven analytics
The system fuses location-based intelligence with detailed metadata about military units:
- Satellite imagery integration — algorithms correlate troop movements, supply routes, and camp locations with high-resolution imagery.
- Cell phone data correlation — communications footprints identify active or idle units and possible staging sites.
- Defensive strategy mapping — known fortifications and defensive lines are overlaid to expose potential vulnerabilities and strategic chokepoints.
Interactive dashboards
A password-protected, role-based Dash Plotly web application presents real-time maps, charts, and intelligence layers:
- Drill-down views from a broad geographic overview to individual units in a few clicks.
- Layered geospatial data — distinct layers for troop locations, vehicle movements, and defense lines.
- Custom alerts and filters that flag suspicious movements, newly identified camps, or potential massing of forces.
Security
Wartime intelligence demands strict access control. Encrypted connections and multi-factor authentication restrict entry to authorized personnel, and granular role-based permissions ensure sensitive data — such as coordinates of specialized units — is visible only to individuals with the proper clearance.
Impact
- Real-time situational awareness. Planners and analysts react quickly to shifting front lines and anticipate probable escalations or breakthroughs.
- Better decisions for defense stakeholders. A single pane of glass over open-source intelligence helps the U.S. Army and allies organize deployments, protect supply lines, and adjust strategic posture.
- Efficient resource allocation. Automated intake and analytics remove hours of manual data sorting, freeing intelligence teams for deeper research and scenario planning.
- Built to extend. The cloud architecture accommodates new data sources, new geographic areas, and evolving intelligence requirements without rework.
We build this for other defense and intelligence organizations: ingest, reconcile, map, control, around the feeds you have. Talk to us.
Frequently asked questions
- What is a real-time GIS intelligence dashboard?
- A live, interactive map that fuses multiple intelligence sources, satellite imagery, mobile-device data and open-source intelligence, into one continuously updated operational picture, replacing static briefings that age by the hour.
- What data sources can be fused into the map?
- In this deployment: satellite imagery, mobile phone data and open-source intelligence (OSINT), merged into consistent entities such as unit locations, supply lines and defensive positions. The ingestion layer is built per engagement around the sources you have.
- How is sensitive intelligence data secured?
- Security is part of the architecture, not an afterthought: multi-factor authentication, role-based access controls that decide who sees which layers, and an auditable trail of access. The deployment model is shaped to the client's security requirements.
- What does it run on?
- This deployment runs on Google BigQuery for large-scale geospatial queries with an interactive Dash Plotly front end. The architecture ports to the cloud and security environment your organization requires.
- Who uses this kind of system?
- Defense and strategic intelligence organizations. This deployment gives a European intelligence organization live visibility of military activity in an active conflict zone and informs decisions for defense stakeholders.